A Happy New Year ❤
I’m now a Christian, MichiroJohn (^^;.
Japan has a tradition giving money to children at New Year event. It’s not really Buddhism culture, but I’ll kick them away at all. I have no money !!
Income and Expenditure in December 2024
| carryover money | 46,644 yen▼ | details__ |
| internet charges (mon) | 1,100 yen▼ | 38,500 yen▼ |
| domain acquisition fee | 0 yen_ | 1 yen▼ |
| domain renewal fee (1yr) | 0 yen_ | 4,198 yen▼ |
| buy plugin | 0 yen_ | |
| buy software | 0 yen_ | |
| affiliate income | 0 yen_ | |
| surveyance costs | 0 yen_ | 5,045 yen▼ |
| total | 47,744 yen▼ | 47,744 yen▼ |
Nothing changed specially.
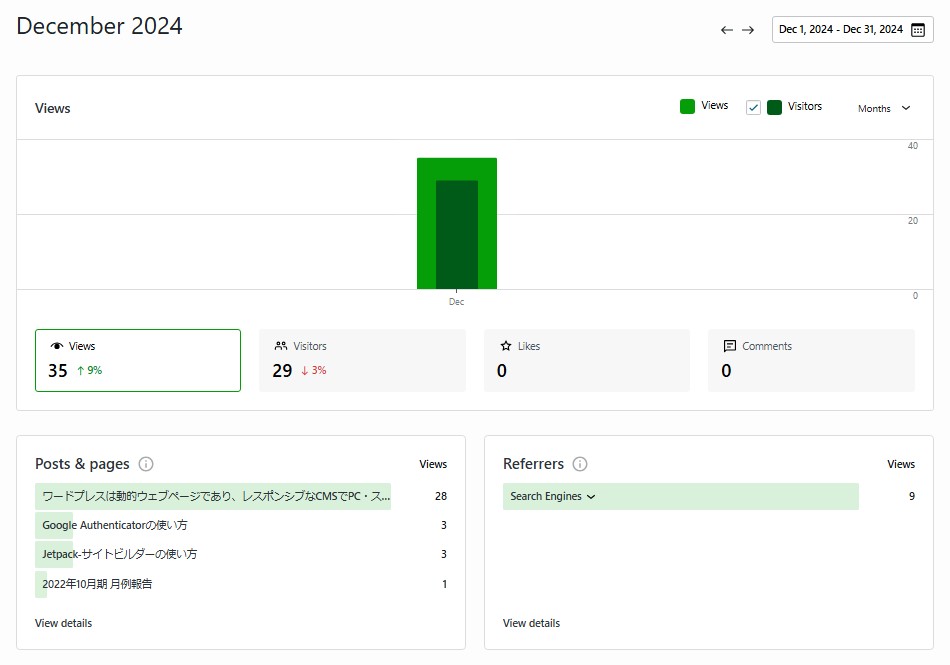
The number of viewers has almost exceeded 30.
The post that is a how-to article has the lower number of viewers, so it looks good.
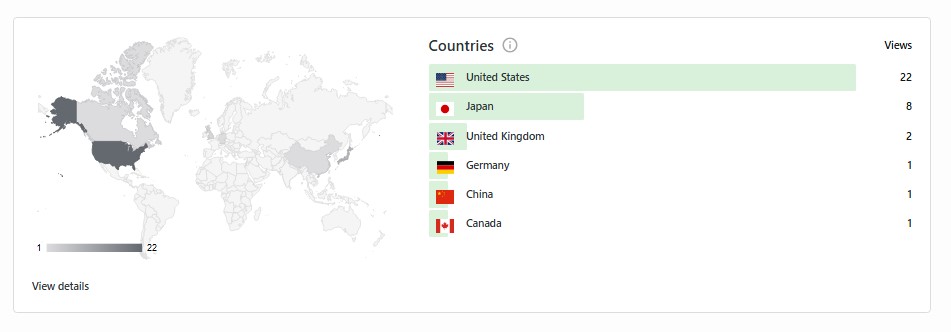
Look at the countries.

Yeah. I got the people from China ❤
Next, I would get the people from Southeast Asia and India.
Actually, someone in Singapore has already checked my site.
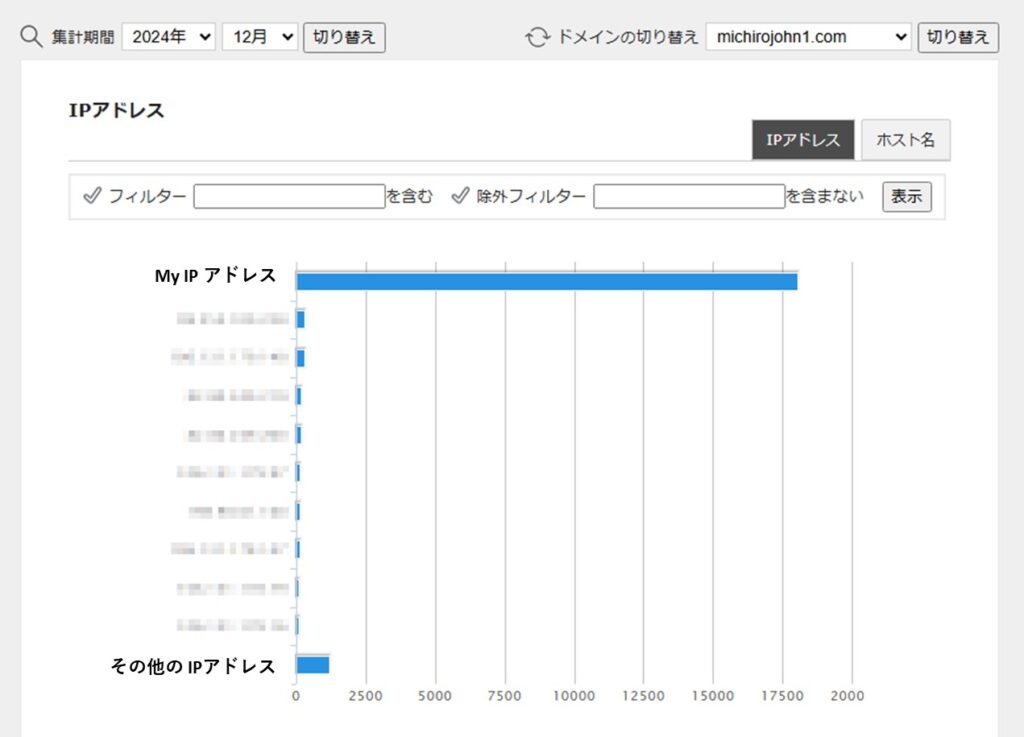
He’s tried to login to my account dozens of times.
He might not help without seeing my site (^^;.
The Deteriorations in the world 3 — Excel’s (continued)
I will continue dissing Excel (^^;.
I’ve been getting along with Excel for over 20 years now (-_-). I’d like to say there’s no wonder to use it, but still, I can’t understand at all (^^;. In my work, once I used Excel for my company’s accountancy, but it was not completely understandable (*_*). I wanted to use the accountancy software.
I have the second grade of Excel specialist, however.
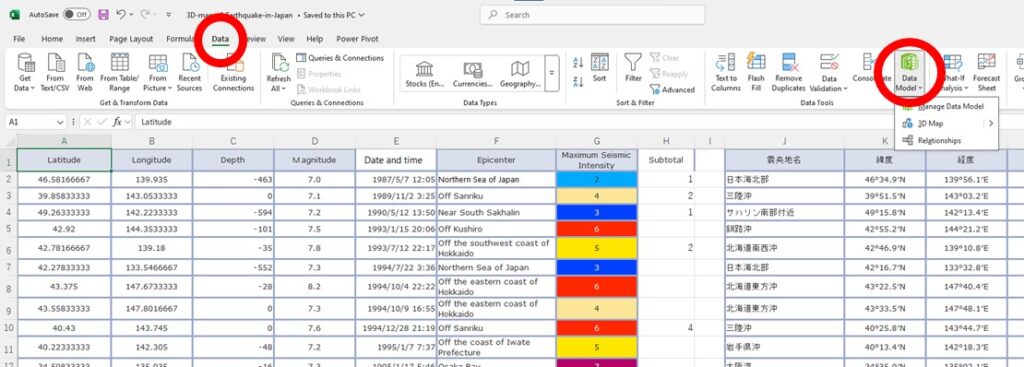
While I was checking around of Excel for dissing, I lost where the 3D map is. —— It got a sensational debut around 2016, and many people created it on the Internet. Now it’s a feature that no one uses, and I never see it again.
—— Where is he now ? ?
I found it.

He is there.
He’s gone from Home tab.
I’ll give him an advice as a senior.
It’s easier to live quietly in the countryside like that (-_-)y-.
Jokes aside, let’s check the 3D map to see whether any changes are there.
I made it practically.
He did not change himself at all (^^;.
He can only make it into a video. Nothing changed. It makes hard to use for presentations. When the discussion gets heated, there needs to stop the video and move the image forward or backward, but PowerPoint does not have such function. It cannot slow down the display speed between frames either. It just keeps playing at ultra high speed. Also, the bar graph is only shaped as square, so the square frame is shown on top of its heat map.
To say whether it is a deterioration or not, it’s just same than before. It’s just a story the location is changed.
I understand the reason why people don’t use him.
It just looks something funny. Not for work (^^;.
Excel cannot create 3D graphs
Since Excel was originally designed to create only 2D graphs, Google Spread even can’t create 3D graphs either. But if you want to use a 3D graph for a presentation, it’s best for you can handle it as you want.
It looks like this.
This is a map of all earthquakes that have occurred between 1985 and 2020 in Japan. I can draw a map of Japan using only dots. It’s scary to see that the Izu-Ogasawara Trench has a fault line that runs almost vertically. It makes sense why there are so many earthquakes in Japan. I used Graph-R to draw it. The magnitude is by colored.
I had wanted to use a 3D model object instead of a video.
It’s so expensive !!
I stopped (^^;.
End
[Thanks Japan Meteorological Agency for giving a lot of excellent data to me]
If you feel this article “Like!”, click the ads below ⇩⇩
Your click makes my affiliate income. It motivates me (^^;.
If you give a tip ——
-e1.gif)


Leave a comment(コメントを残す)